Telling Stories With Data Maps
Telling Stories With Data Maps

How can mapping be used to tell data-rich stories about context and design?
As forward-thinking designers and planners, this is a question we are constantly asking ourselves at Cuningham Group. For many years we’ve used ArcGIS — the industry-standard geographic information system software — to gather information about our projects’ sites. Recently, however, we have also begun using mapping to collect and distill economic, cultural and demographic data into intelligible stories — stories that not only help us better understand our clients, but help our clients better understand their projects' environmental contexts.
ArcGIS
ArcGIS draws data from a range of disciplines including cartography, demographics, geography, city planning and management, and site surveying. By leveraging disparate sets of data from multiple public and private sources, we can illustrate changes in population, economies, the built environment and social fabrics over time.
Cuningham Group uses this data in many ways. Most recently, we have been using it to tell stories early in the design process. For example, a small change in property value within one area of one neighborhood may be unremarkable by itself. But when framed in a larger context, the interconnected factors that created this change can be better understood — in turn, allowing clients to better understand their project’s civic ecosystem.
This method of data-driven storytelling provides our design teams with unique insights into how a project should position itself in relation to its context, allowing us to plan for future growth and build consensus among project stakeholders.
[gallery columns="2" ids="23461,23460"]
Mapping in the Pre-Design Phase
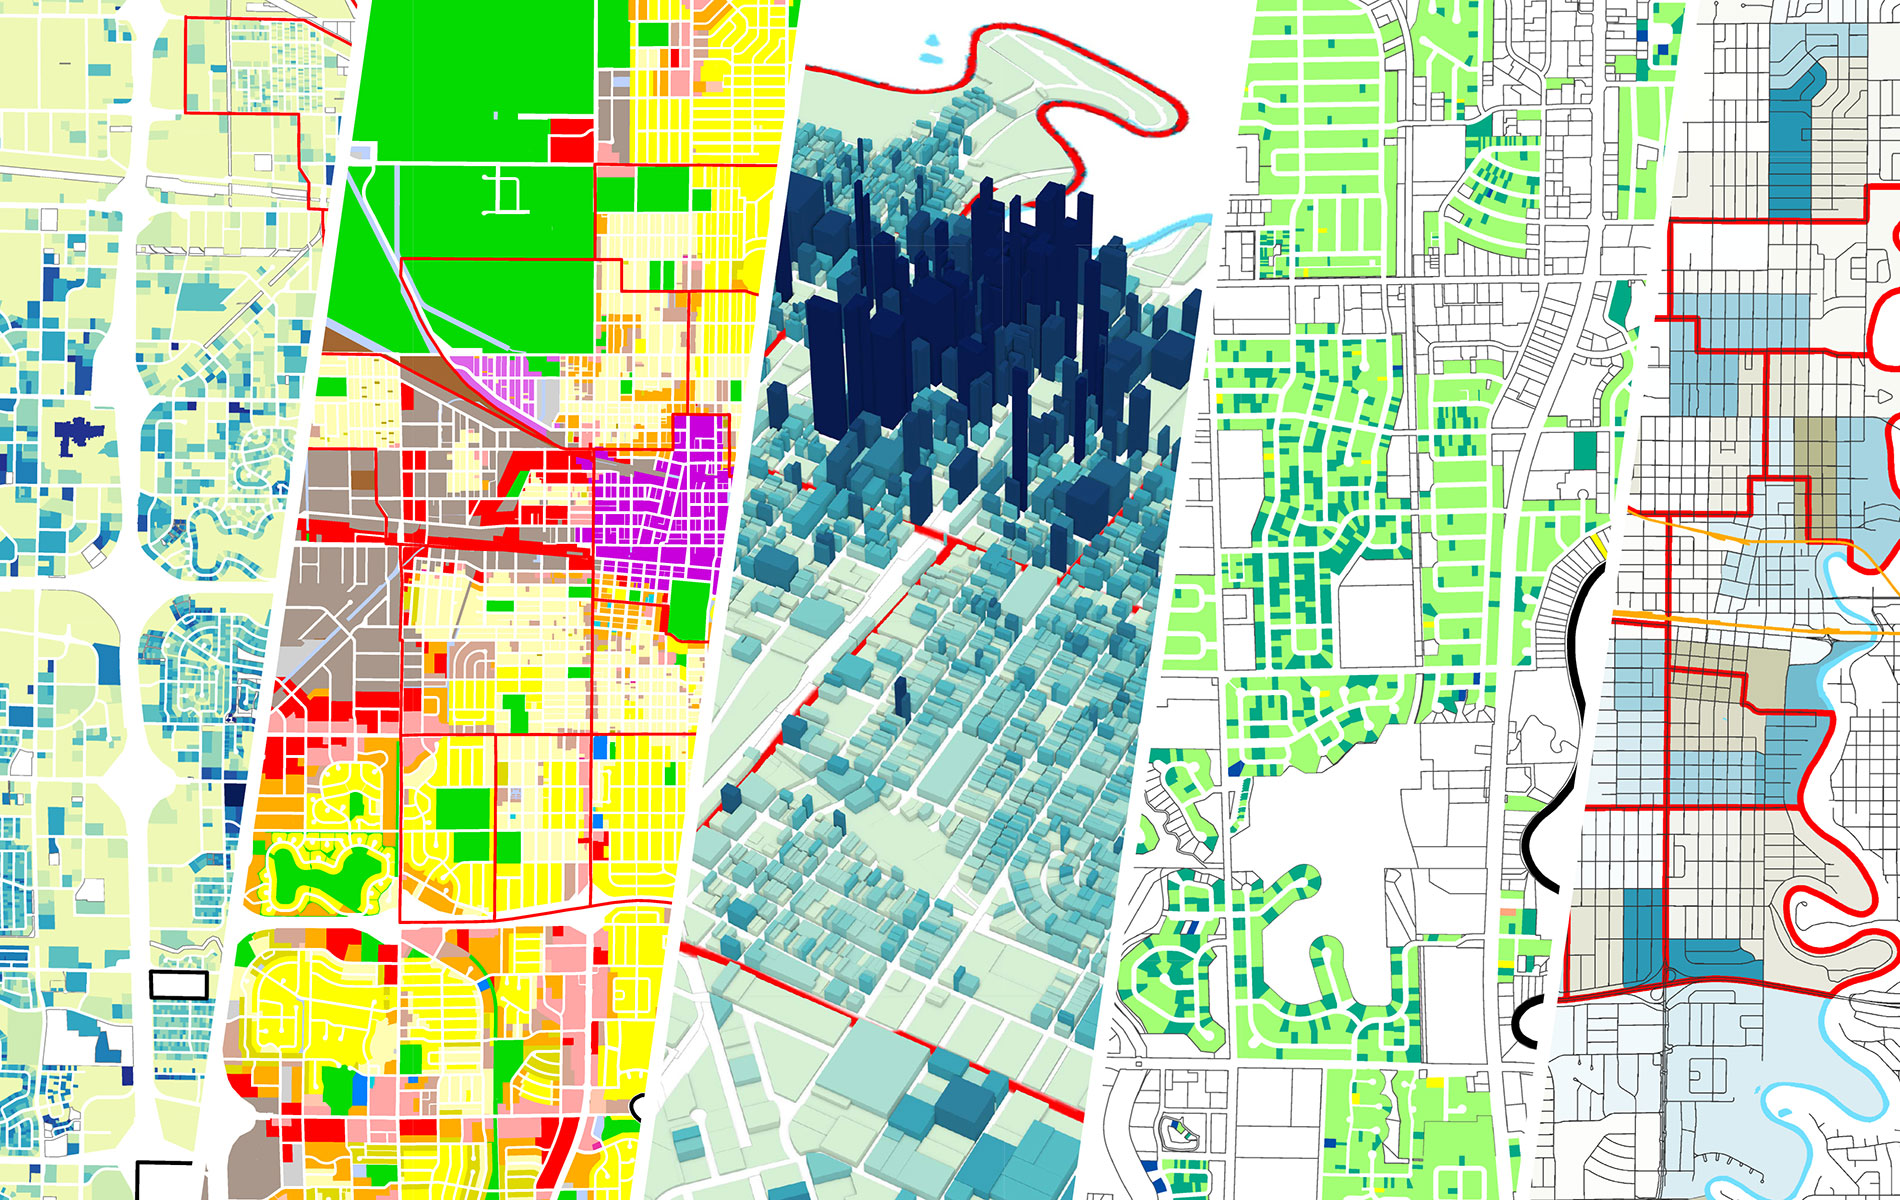
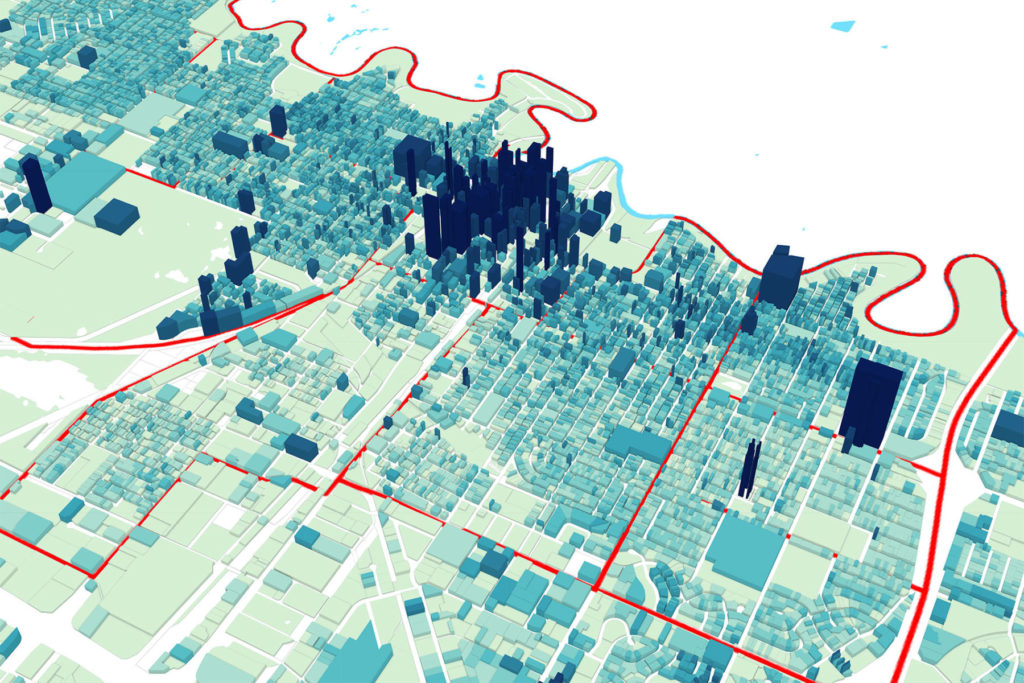
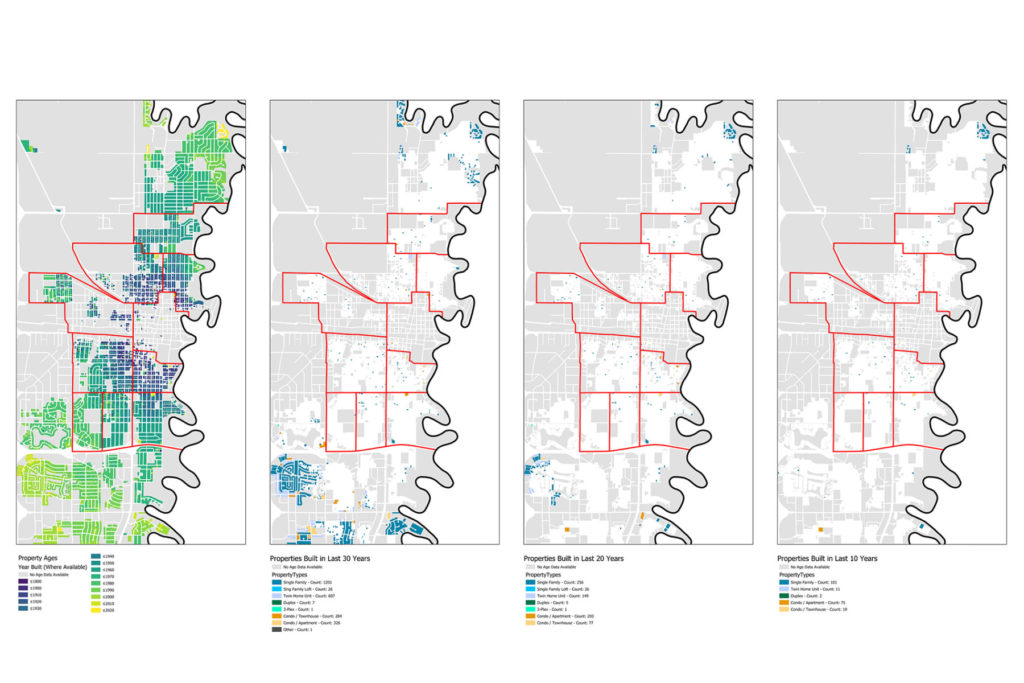
A good example of how we are using these tools is our recent response to an urban planning project for several neighborhoods in the city of Fargo, ND. The neighborhoods, located radially around the historic downtown, had been selected to receive master planning services to address future growth and development. Despite their proximity to each other, these neighborhoods had significant differences in student populations, resident age, incomes, home ownership, property age and quality, property values, and historic designation.
By mapping these attributes in relation to one another and their changes over time, we discovered commonalities and differences between the different neighborhoods, helping our planners to have a stronger understanding of how the city could develop over time to best serve all residents. [See images below]


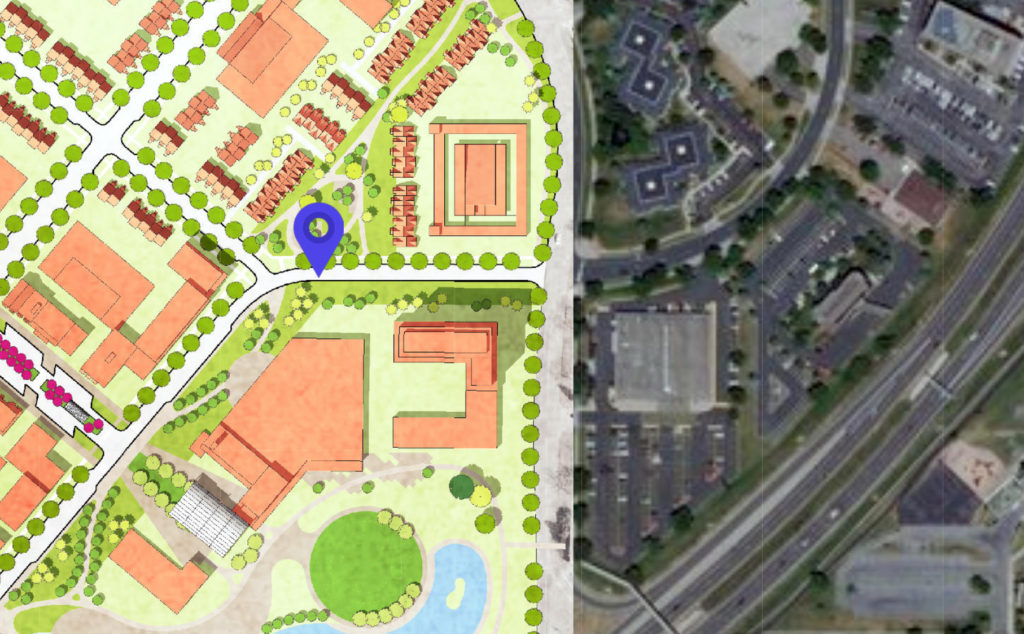
Mapping has also proven to be a valuable method of presenting early phase concept designs back to clients, assessing site conditions in the context of the design, and tracking photographs and notes during site analysis. When designing large scale sites, early stage drawings are made to show site relationships and building volumes. These expressive 2D drawings can then be given real world geographic space and our teams can physically walk across the site with the client showing where on the greenfield or renovation project a new building or site feature will be located — like pins dropped on Google Maps.

Mapping strategies can be applied to both small-scale projects and larger, city-wide efforts. From connecting a casino project to its greater community, to helping a school district plan 30 years into the future, to property searching for developers, our efforts to go further with the power of map making and data visualization allows us to tell each client’s unique story in a way that illuminates opportunity and informs design.